BM101.SLS
⏰Estimated Practice Time: 30 Minutes
Objective
Learn how to create a Sales Log to calculate revenue for products using simple Excel formulas and formatting.
Scenario: Sales Log
Set Up Your Sales Data Table:
Open Excel and create the following headers in Row 1:
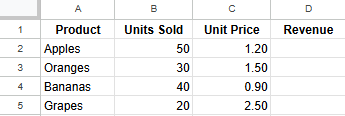
A1: "Product" | B1: "Units Sold" | C1: "Unit Price" | D1: "Revenue"
Format the headers:
Select cells A1:D1, click Bold, increase the font size to 12, and apply a light fill color for clarity.
Input Sample Sales Data:
Starting in Row 2, enter the following product details:
Calculate Revenue for Each Product:
In cell D2 (under "Revenue"), enter the formula to calculate revenue:
=B2*C2
This multiplies the Units Sold (B2) by the Unit Price (C2).
Press Enter, and the revenue for Apples will display.
Copy the formula down by dragging the fill handle from D2 to D5.
Format Numbers as Currency:
Highlight the "Unit Price" and "Revenue" columns (C2:D5).
Go to Home → Number Group → Currency or use Ctrl + Shift + $.
Calculate the Total Revenue:
In Row 6, type the following labels:
C6: "Total Revenue"
In cell D6, calculate the total revenue using the SUM formula:
=SUM(D2:D5)
Press Enter to display the total.
AutoFit Columns for Readability:
Double-click the column separators between A, B, C, and D to adjust the column widths.


