BM101.Mktg
⏰Estimated Practice Time: 30 Minutes
Objective
Learn how to create an Ad Campaign Budget Sheet to track advertising spend across platforms, calculate totals, and format the sheet for clarity.
Scenario: Ad Campaign Budget Sheet
Set Up Your Ad Campaign Table:
Open Excel and create the following headers in Row 1:
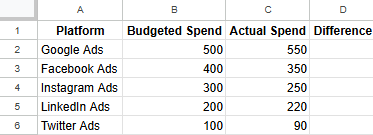
A1: "Platform" | B1: "Budgeted Spend" | C1: "Actual Spend" | D1: "Difference"
Format the headers:
Select cells A1:D1, click Bold, increase the font size to 12, and apply a light fill color (e.g., light blue).
Input Sample Campaign Data:
Starting in Row 2, enter the advertising platforms, budgeted spend, and actual spend as follows:
Calculate the "Difference" Column:
In cell D2 (under "Difference"), enter the formula to calculate the difference between budgeted and actual spend:
=B2-C2
Press Enter.
Copy the formula down by dragging the fill handle from D2 to D6.
Format Numbers as Currency:
Highlight the "Budgeted Spend," "Actual Spend," and "Difference" columns (B2:D7).
Go to Home → Number Group → Currency or use the shortcut Ctrl + Shift + $.
Calculate Total Spend:
In A7, type the following label: "Total"
Use the SUM formula to calculate totals:
In cell B7, enter:
=SUM(B2:B6)
In cell C7, enter:
=SUM(C2:C6)
Highlight Over-Budget Campaigns:
Select the Difference column (D2:D6).
Go to Home → Conditional Formatting → Highlight Cell Rules → Less Than.
Enter 0 and choose a light red fill.
This highlights campaigns where actual spend exceeded the budget.


